
The combines are parked, the fall calves are weaned, and this week most of the country sits down to Thanksgiving. It is the one stretch of the year when a farmer has time to look at the season from a distance, and there is now a way to do that literally. Every image the Landsat satellites have taken of your fields is free to download, the European Sentinel-2 satellites photograph the same ground in finer detail every five days at no charge, and USDA, NASA and university teams have turned those pictures into crop maps, soil moisture readings and pasture production estimates. Here is what the satellites measure, what a pixel covers on a small farm, which free tools are worth bookmarking, and how a diversified operation uses them for scouting and pasture recovery.
What a satellite actually sees: NDVI in plain terms
Nearly every vegetation map you will meet is built on one number, the Normalized Difference Vegetation Index, or NDVI. It rests on a fact about leaves. Chlorophyll strongly absorbs the visible light that hits a plant, while the cell structure of a healthy leaf strongly reflects near-infrared light that our eyes cannot see (NASA Earth Observatory, Measuring Vegetation). A satellite records both. NDVI is near-infrared minus red, divided by near-infrared plus red, which on Landsat 8 and 9 means Band 5 and Band 4 (USGS, Landsat NDVI).
The result always falls between minus one and plus one. NASA's reference values are a fair rule of thumb: bare rock, sand or snow at 0.1 and below, shrub and grassland around 0.2 to 0.3, temperate and tropical rainforest at 0.6 to 0.8, and the thickest green canopies between 0.8 and 0.9.
NDVI is a greenness index, not a yield monitor, a protein test or a soil map. It is most useful as a comparison: this field against that one on the same date, or one field against itself across a season. The shape of a field's curve from green-up to senescence says more than any single value.
The satellites and what a pixel means on your farm
Three public systems matter for a US farm, and the trade-off is always the same: detail against frequency.
Landsat 8 and 9
Landsat 8 launched on February 11, 2013, and Landsat 9 on September 27, 2021. Each images in visible, near-infrared and shortwave-infrared bands at 30 meters, each passes over the same spot every 16 days, and because the two are offset by eight days, the pair covers every piece of US farmland about every eight days (USGS, Landsat 8; USGS, Landsat 9). A 30-meter pixel covers 900 square meters, roughly a fifth of an acre: coarse for a market garden bed, fine for a 20-acre hay field. The program has collected comparable images continuously since 1984 (RAP, Vegetation Cover Dataset), which makes Landsat the backbone of every long-term tool.
Sentinel-2
The European Space Agency's Sentinel-2 satellites image blue, green, red and near-infrared at 10 meters. Sentinel-2A launched on June 23, 2015, Sentinel-2B on March 7, 2017, and together they revisit the same ground every five days (ESA, Sentinel-2; Copernicus SentiWiki, Sentinel-2 mission). A 10-meter pixel is about a thousand square feet, small enough to show the wet corner of a field or the strip a planter missed. A third satellite, Sentinel-2C, went up on September 5, 2024, and will replace Sentinel-2A after a brief period of tandem observations (ESA, Sentinel-2C joins the Copernicus family in orbit). For a small farm this is the workhorse.
MODIS
NASA's MODIS instruments on the Terra and Aqua satellites view the whole Earth every one to two days, but the sharpest bands are 250 meters across (NASA, About MODIS; NASA, MODIS specifications). One pixel is about 15 acres. You will not scout a field with it, but it sits behind the daily national condition maps, and daily matters when a drought or a flood is developing.
NASA's Goddard Space Flight Center also blends Landsat 8 and 9 with Sentinel-2 into one consistent 30-meter record called HLS, so the two systems can be used as if they were a single collection, which gives higher-frequency coverage of a field than Landsat's 16 days alone (NASA Earthdata, HLS). It is free, and many NDVI time-series tools run on it.
Where to get the pictures for free
The Copernicus Browser is the easiest place to start. The Copernicus Data Space Ecosystem provides free, instant access to Sentinel data under the program's free and open data policy, and the browser is its web interface for viewing, analyzing and downloading imagery. You can dive into the data immediately, and registering an account unlocks the full set of services. Zoom to your farm, pick a cloud-free date, switch the layer to NDVI, and you are looking at your fields in false color within minutes.
USGS EarthExplorer is the search and download interface for the Landsat archive, including Collection 2 surface reflectance scenes. In 2008 the products in the USGS archive became available at no cost to users (USGS, Landsat data access), the decision that made all of this possible.
NASA's Worldview is for the big picture: an interactive browser for full-resolution daily imagery, much of it available within hours of acquisition. Open it the morning after a storm, a wildfire or a late snow, before you drive the county.
Precision agriculture used to begin with a sensor purchase. Today it can begin with a browser tab, provided your rural broadband can carry a few hundred megabytes of imagery.
USDA's own tools: the Cropland Data Layer and Crop-CASMA
The Cropland Data Layer is a georeferenced, crop-specific raster of the continental United States that the National Agricultural Statistics Service updates every year from satellite imagery and ground truth, with 30-meter pixels of about 0.22 acre each; every year's layer is public domain and free to download, and each new one is released in January, once the growing season and the year-end county estimates are done (USDA NASS, CroplandCROS FAQs). USDA's CroplandCROS application lets you explore, compare and download the layer and estimate acreage for any area you draw or upload: see what a piece of rented ground actually grew over the last decade before you sign the lease, or check how much corn and soybean sits within a mile of a proposed organic field.
Crop-CASMA, the Crop Condition and Soil Moisture Analytics tool, was released in March 2021 by NASS with NASA and George Mason University. It maps soil moisture from NASA's SMAP satellite, launched on January 31, 2015 (NASA, SMAP). Raw SMAP readings are 36 kilometers across, about the size of a county, so the team built a downscaled 1-kilometer surface product and a 9-kilometer root-zone product that reads to roughly three feet, alongside MODIS vegetation condition indices, all free (NASA, Data Powers New USDA Soil Moisture Portal). NASS uses it to spot fields too wet, too dry or too frozen to plant. A farmer can use it the same way in April, paired with in-field soil moisture sensors for the detail a satellite cannot deliver.
Pasture tools: the Rangeland Analysis Platform and Grass-Cast
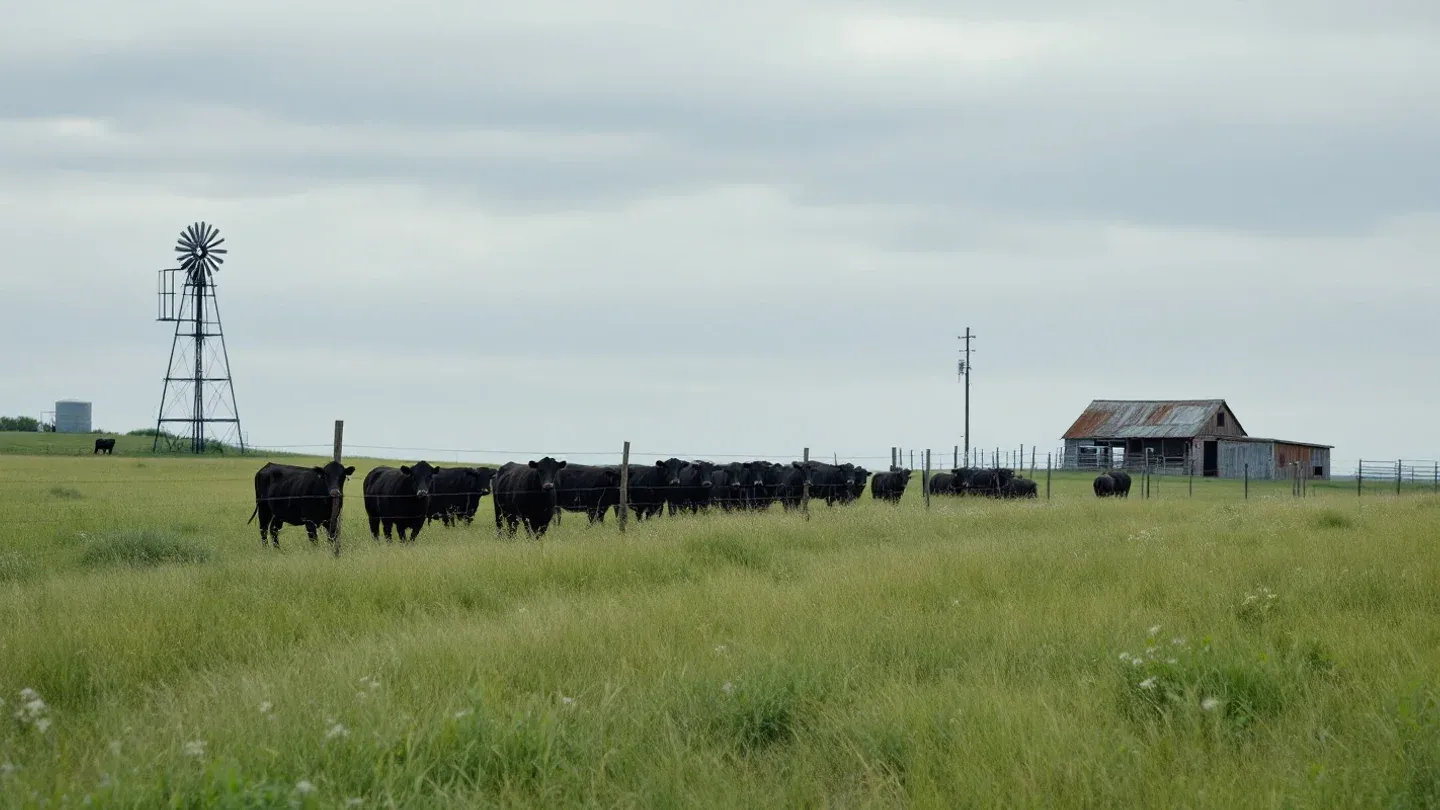
Graziers have been the quiet winners of free imagery, because grass responds to rain and rest in ways a 30-meter pixel shows well.
The Rangeland Analysis Platform was developed by the University of Montana in partnership with USDA's Natural Resources Conservation Service and the Bureau of Land Management. It combines the Landsat record with some 75,000 field plots from NRCS, the Bureau of Land Management and the National Park Service to map annual percent cover of grasses, forbs, shrubs, trees and bare ground at 30 meters from 1986 to the present across the United States, and it estimates new aboveground production in pounds per acre at annual and 16-day steps over the same period (RAP, Products; RAP, Rangeland Production Dataset). The 16-day estimate is driven by Landsat NDVI through the growing season, which is exactly the recovery signal a rotational grazier wants. The data carry no use restrictions, and the platform is plain that its production model is built for rangeland, not cropland or forest.
Grass-Cast looks forward instead of back. Built by Colorado State University, USDA, the National Drought Mitigation Center at the University of Nebraska-Lincoln and the University of Arizona, it uses almost 40 years of weather and vegetation growth data with seasonal precipitation forecasts to predict whether each 10-kilometer grid cell in the Great Plains and the Southwest will grow above-normal, near-normal or below-normal grass that summer (Grass-Cast maps). It updates every two weeks in season, forecasts total rather than grazeable production, and cannot tell your desirable species from your weeds. Read it in April beside your stockpiling and winter feeding plan, and adjust stocking before the drought arrives rather than after.
How a small farm uses imagery
In practice a small operation uses these tools for four jobs.
Scouting where to walk
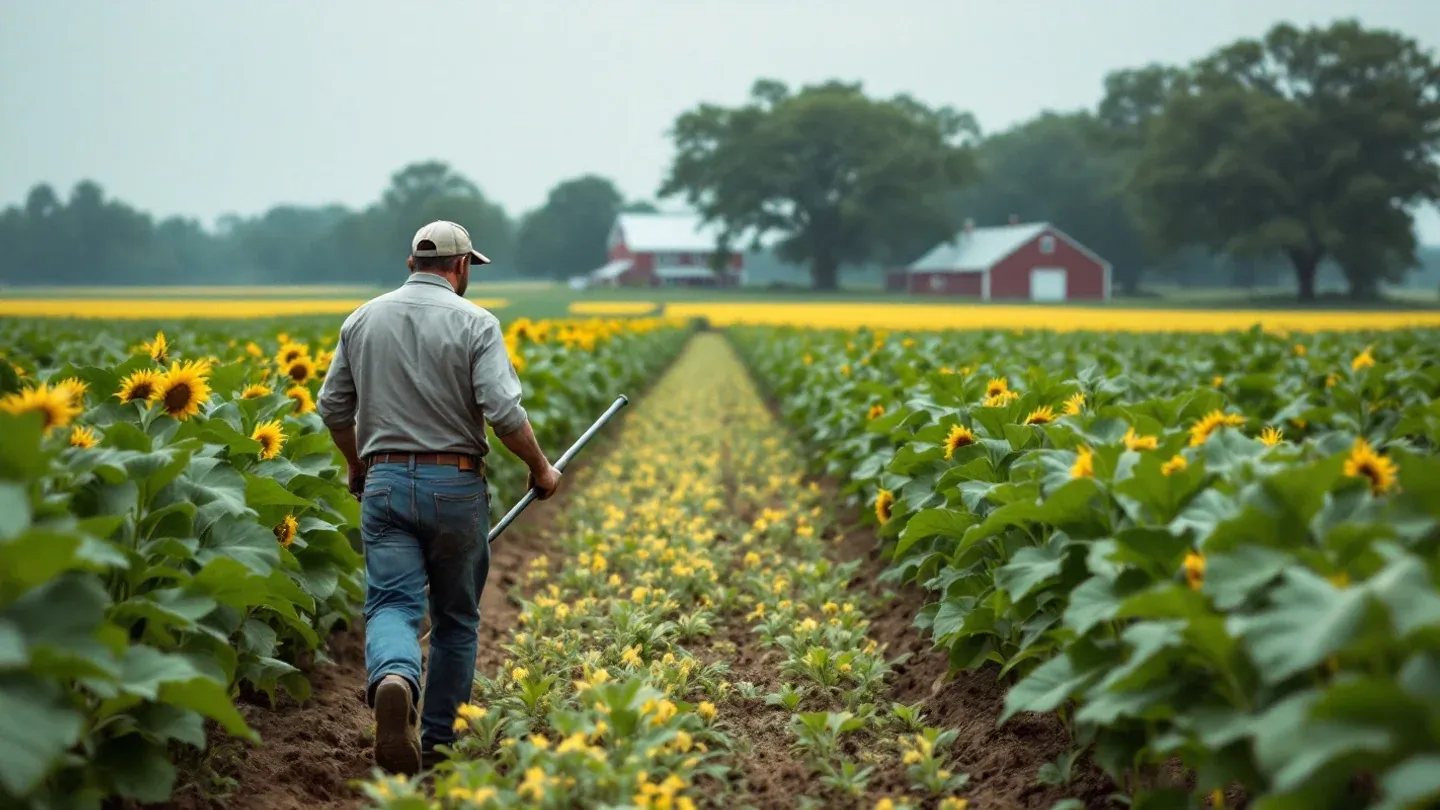
A 10-meter NDVI image does not tell you what is wrong, but it tells you where a field is not keeping up with itself. Pull a Sentinel-2 image every week or two, note the low spots, and walk those first. A compaction streak, a wet corner, a planter skip or a nitrogen-starved patch all show as a dip in greenness before they show from the truck. It is the principle we argued for with drones, at zero cost and without the battery.
Drawing zones
Several years of imagery on one field tend to show the same pattern: a consistently strong area, a consistently weak one, and a middle. Those are your management zones, where you take separate soil samples rather than one blended bag, and where a soil carbon baseline, the kind the carbon contracts we looked at two weeks ago require, should be stratified. The imagery does not replace the probe. It tells the probe where to go, which is the first step in any plan to heal the soil.
Tracking pasture recovery
Pull up a paddock in the Rangeland Analysis Platform and look at the 16-day production curve for the last three summers. The dates where production stalls tell you where rest periods were too short, where stock density ran too high, or where a dry spell hit. That is the record a holistic grazing plan needs and few farms keep on paper. Our six principles of grazing management still hold; the satellite grades the homework.
Checking establishment
In late November a cover crop drilled after corn should be visibly green from orbit. If a field reads like bare soil in the Copernicus Browser, the stand failed, the seed washed or the window closed, and you want to know before you plan next year's cover crop mix around it.
The limits to respect
Imagery misleads in predictable ways. Clouds come first: optical satellites see nothing through them, and a five-day revisit becomes a month in a wet spring. Pixel size is second: a 30-meter pixel mixes a field edge, a fence line and a headland into one number, so trust the centers of fields and distrust the edges. NDVI itself is third: it measures green leaf, not biomass once the canopy closes and never nutritive value, so every reading needs a boot on the ground beside it, as the makers of Grass-Cast say themselves. And time is fourth. The simplest workflow is the one you will keep: one browser, one index, one look per field per fortnight, written in the same notebook as the rainfall.
A winter project
Here is how we would spend the quiet weeks ahead.
- Open the Copernicus Browser, find the farm, and save a cloud-free Sentinel-2 NDVI image from each month of the 2024 season.
- Mark the three weakest spots on each field and put them on the spring scouting list, with a soil sample from each.
- For every paddock, save the Rangeland Analysis Platform's 16-day production curve for 2022, 2023 and 2024 and lay it beside your grazing records.
- Pull rented or prospective ground up in CroplandCROS and write down its crop history.
- Bookmark Crop-CASMA and Grass-Cast for April, when soil moisture and the summer grass outlook are the decisions that matter.
The satellites were paid for long ago, the data are public, and the tools were built with farmers in mind. What imagery gives a small farm is the long view, a decade of a field's behavior in an afternoon, and thinking long term is the whole of regenerative management. For people who can take this further on your farm, our directory of service providers and manufacturers is a starting point. The podcasts, blogs and videos we list include good teachers on remote sensing. Start with one field, one index and one winter, and see what the sky has been saying all along.